
England and Wales are areas with a diverse culture, history, and heritage. People move there for the sake of getting more and better working opportunities due to its strong currency stabilisation. England and Wales are always very important for the world and play crucial roles in economies and making world rules. People come from different parts of the world in search of good living standards. But good and bad are both parts of this place.

Key Takeaways
-
Crime statistics are sourced directly from the UK’s Police Website and represent official public data.
-
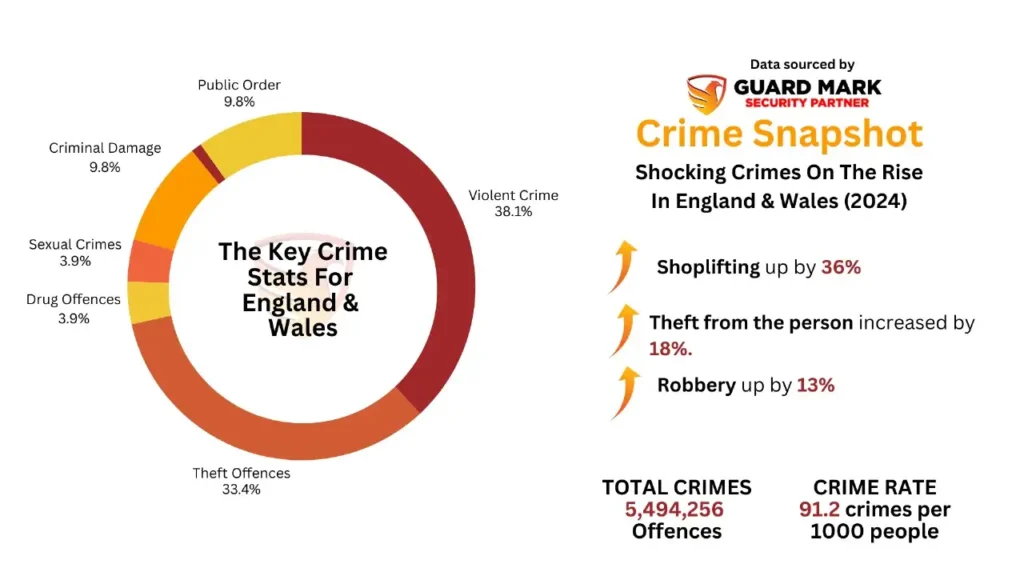
The average crime rate across England and Wales is 91.2 crimes per 1000 population, with a slight decrease of 1% in overall crime in the last 12 months.
-
Westminster is the most dangerous area with 440 crimes per 1000 population, followed by Camden (184.2) and Manchester (172.6).
-
Violent crimes (2,049,254 cases) and theft (1,789,462 cases) are the most common offences across England and Wales.
-
Shoplifting has seen the largest increase at 36%, while public order offences have decreased by 13%.
-
Weapon-related crimes are rising, with knife crimes up by 7% and gun-related offences increasing by 9%.
-
Major cities outside London with high crime rates include Manchester, Liverpool, Birmingham, and Leeds.
-
Businesses in high-risk areas should consider security guarding services, mobile patrols, and CCTV surveillance to enhance protection.
-
Guard Mark Security provides comprehensive security solutions tailored to the specific needs of businesses across England and Wales.
The Impact of Population Growth on Crime
Undoubtedly, these places open up many great opportunities but the crime rate here is also very high which has been always a problem here. The population of the United Kingdom has increased on a massive scale. According to 2022, the population of the UK is 66.97 million and a lot of them are not permanent residents due to which, the crime rate is increasing. Besides the strict laws and policies, theft and vandalism are common crimes in England and Wales.
As we have mentioned both the good and bad are parts of these places and today, we are going to discuss the top 10 roughest places in England and Wales. There is no doubt that there are places with amazing living standards but there are also some places with the worst living standards due to high criminal and illegal activities.
As a well-known security company, we know how important is to educate people by providing them with fresh information. In today’s article, we are going to share the crime rates, types of crimes, and their stats with you about the top 25 most dangerous areas in England and Wales.
Table of Contents
Is England & Wales Safe?
Before starting the article, please keep in mind that all of this information is taken from the UK’s Police Website. All the data is publically available and anyone can access it to check the crime rate and statistics.
In the last 12 months, the total number of criminal offences that happened in England and Wales is 5,494,256 which mean the average crime rate is 91.2 crimes per 1000 population.
The most common crimes in England and Wales
| Crime | Number of Incidents |
|---|---|
| Violent Crimes | 2,049,254 |
| Theft | 1,789,462 |
| Shoplifting | 430,104 |
| Public Order Crimes | 516,661 |
| Weapon Possession | 58,989 |
| Robberies | 81,094 |
| Theft from the Person | 125,556 |
The crime rate in the last 12 months in England and Wales reduced by a small margin of 1%.
Which Is The Most Dangerous Area In England and Wales?
Here is the list of the top 25 most dangerous areas according to the crime rates and illegal activities in England and Wales.
| Areas in England and Wales | Overall Crime Rate |
|---|---|
| 1- Westminster | 440 Crimes Per 1000 Population |
| 2- Camden | 184.2 Crimes Per 1000 Population |
| 3- Manchester | 172.6 Crimes Per 1000 Population |
| 4- Middlesbrough | 170.1 Crimes Per 1000 Population |
| 5- Kensington & Chelsea | 160.4 Crimes Per 1000 Population |
| 6- Blackpool | 157.3 Crimes Per 1000 Population |
| 7- Hartlepool | 149.2 Crimes Per 1000 Population |
| 8- Liverpool | 136.7 Crimes Per 1000 Population |
| 9- Hull | 136.7 Crimes Per 1000 Population |
| 10- Doncaster | 134.1 Crimes Per 1000 Population |
#1- Westminster
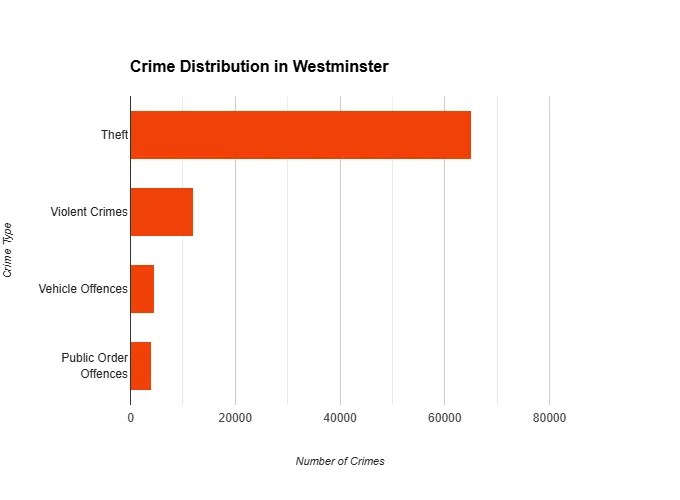
The crime rate in Westminster is 440 Crimes Per 1000 population which makes this city the most dangerous and worst place to live in the whole of England and Wales. The most common crimes here are theft (65,020), violent crimes (11,958), vehicle offences (4,503), and public order offences (4,024).
#2- Camden
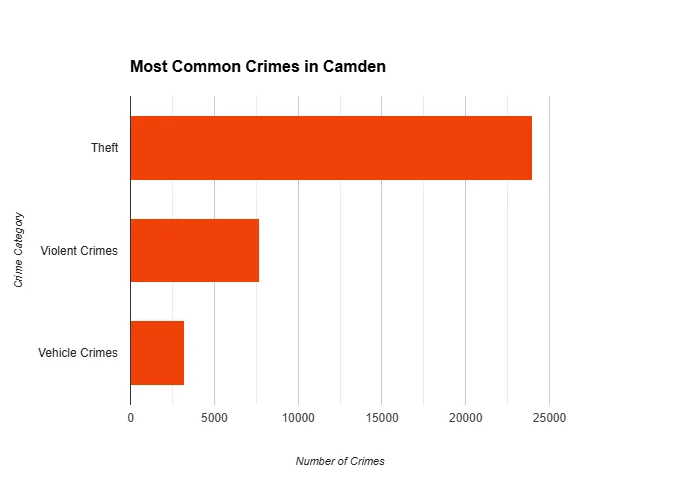
The crime rate in Camden is 184.2 Crimes Per 1000 population making it the 2nd most dangerous area to live in England and Wales. The most common and prominent crimes in this area are theft (23,971), violent crimes (7,702), and vehicle crimes (3,210).
#3- Manchester
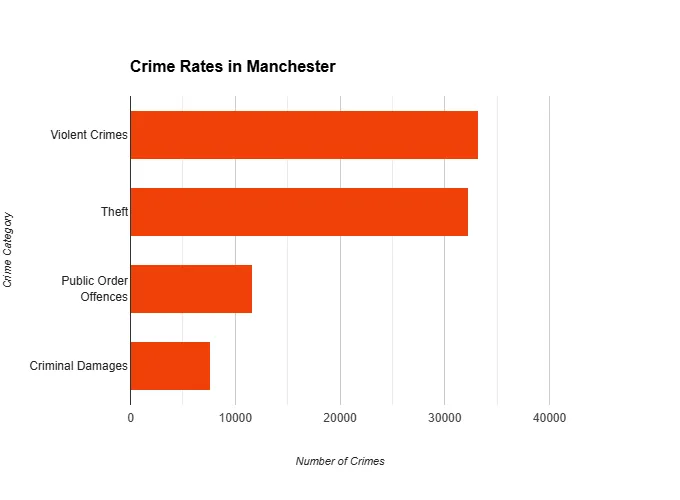
Manchester is a highly populated area with a crime rate of 172.6 Crimes Per 1000 population. The most prominent crimes in Manchester are violent crimes (33,253), theft (32,266), public order offences (11,612), and criminal damages (7,605).
If you want to get detailed information about the crime rates in Manchester, check out our detailed blog ” Top 12 Most Dangerous areas in Manchester,” which we have posted recently in which we have discussed the top 12 roughest places in Manchester.
#4- Middlesbrough
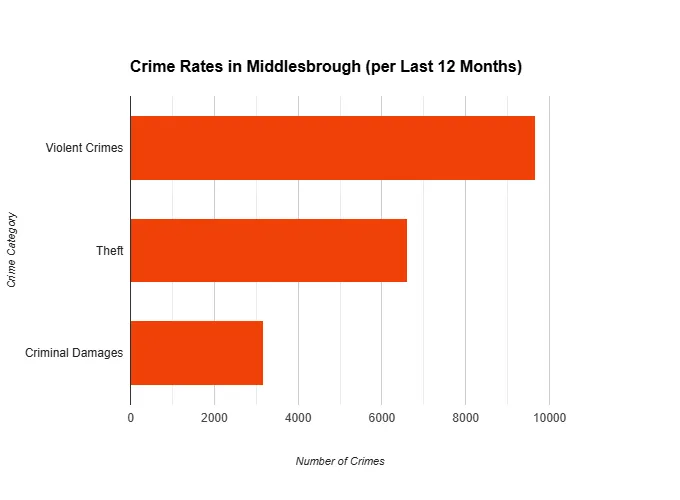
According to the last 12 months’ report shared by the UK’s police, the crime rate in Middlesbrough is 170.1 Crimes Per 1000 population. The criminal and illegal activities in this area include violent crimes (9,675), theft (6,608), and criminal damage (3,173).
#5- Kensington & Chelsea
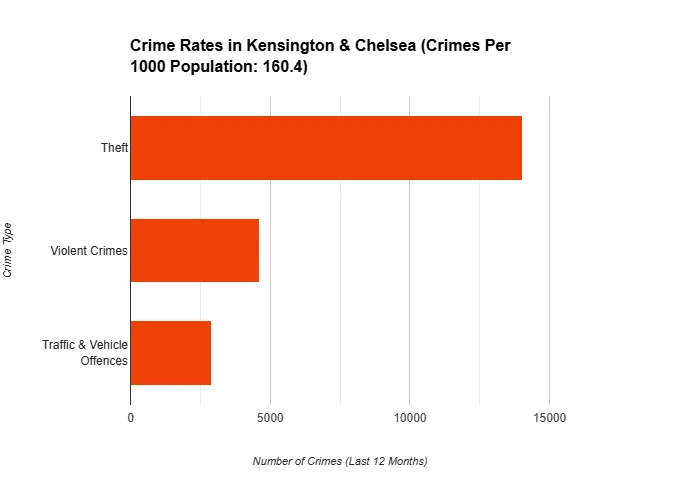
Kensington & Chelsea are known for their football matches and grounds. The crime rate in these areas is 160.4 Crimes Per 1000 population. Most of the crimes that happened in these two areas in the last 12 months are theft (14,032), violent crimes (4,624), and traffic and vehicle offences (2,902).
#6- Blackpool
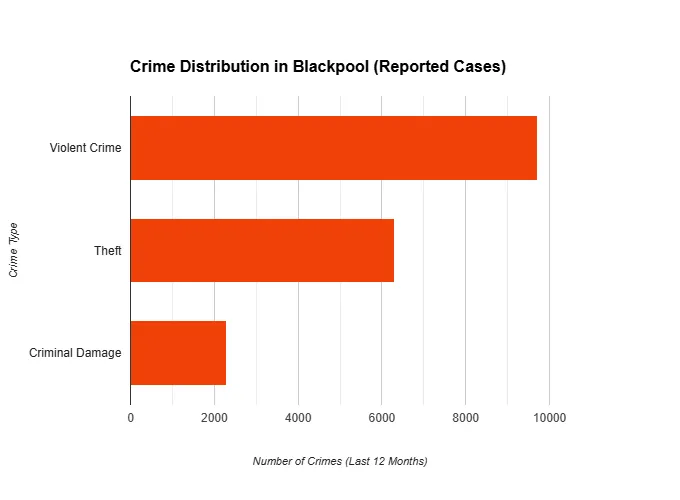
We often hear the name Blackpool when it comes to crimes and illegal activities. The crime rate in Blackpool is 157.3 Crimes Per 1000 population according to the cases reported in the last 12 months. The most prominent crimes in this area are violent crimes (9,703), theft (6,309), and criminal damages (2,283).
#7- Hartlepool
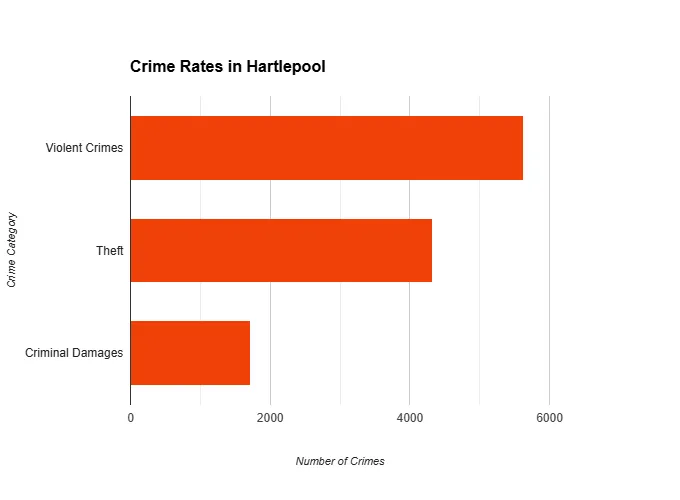
The average crime rate in Hartlepool is 149.2 Crimes Per 1000 population. The most common and prominent crimes in this area are violent crimes (5,629), theft (4,323), and criminal damage (1,716).
#8- Liverpool
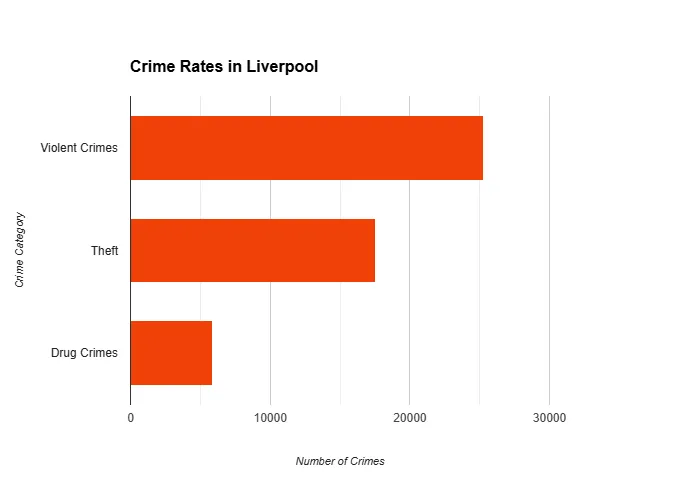
Liverpool is known for its art exhibitions and musical concerts. The crime rate in Liverpool is very high with an average of 136.7 crimes per 1000 population. The most common crimes in Liverpool are violent crimes (25,273), theft (17,532), and drug crimes (5,865).
Check out our detailed blog” Top 10 Most Dangerous Areas in Liverpool” to get more information about the crime rates in Liverpool. You will get to know about all the roughest places in Liverpool and the crime stats there.
#9- Hull
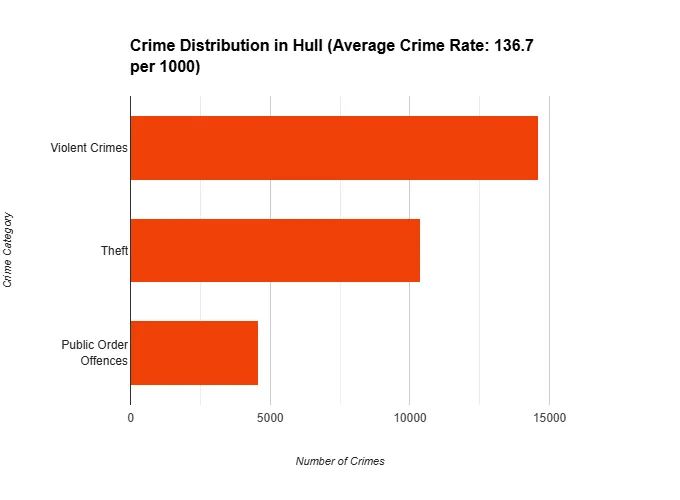
Hull is at number nine with an average crime rate of 136.7 crimes per 1000 population. The most common crimes here in Hull are violent crimes (14,605), theft (10,367), and public order offences (4,582).
#10- Doncaster
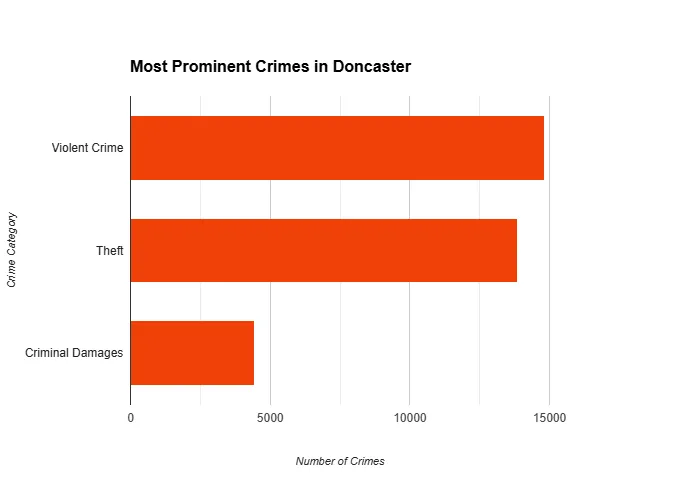
Doncaster is one of England’s and Wales’s top dangerous areas according to criminal activities and living standards. The average crime rate here in Doncaster is 134.1 Crimes Per 1000 population. The most prominent crimes in this area are violent crime (14,822), theft (13,849), and criminal damages (4,455).
#11- Leeds
Leeds, one of Yorkshire’s biggest cities, is famous for its arts and culture. However, it also has a high crime rate of 133.3 Crimes Per 1000 Population. The city reports high numbers of violent crimes (42,516 cases), theft (34,466 incidents), and public order offences (12,102 cases), showing the city’s ongoing safety challenges.
#12- Southampton
With a crime rate of 133.3 Crimes Per 1000 Population, Southampton, a well-known port city, is seeing rising crime numbers. Though it’s often called the gateway to England, concerns are growing over increasing violent crimes (13,203 cases) and theft (10,034 incidents). Burglaries are particularly high here, with 2,407 incidents, which is 77% more than in nearby Portsmouth.
#13- Bradford
Bradford has a crime rate of 132.4 Crimes Per 1000 Pupolation, making it one of the riskier areas in England and Wales. Despite its rich sports and cultural background and recent attempts to boost its business sector, crime remains a serious issue here. Common crimes include violent acts (32,762), theft (17,291), and public order offences (8,323), frequently reported in the news.
#14- Lincoln
Known for its historical importance, Lincoln now faces a less favourable reputation with a crime rate of 131.6 Crimes Per 1000 Population. Serious issues include violent crimes (4,944 cases), theft (4,371 incidents), and incidents of criminal damage (1,347 offences), highlighting growing safety concerns for residents.
#15- Islington
Islington, a popular North London borough, ranks as one of the more dangerous places with a crime rate of 131.5 Crimes Per 1000 Population. Theft (14,294 cases) is a major problem here, making up nearly half of all crimes in the area, alongside high numbers in violent crimes (7,148 incidents) and vehicle offences (2,288 cases).
#16- Wakefield
Wakefield has a crime rate of 130.3 Crimes Per 1000 Population, which impacts its reputation as one of Yorkshire’s well-known cathedral cities with a proud rugby culture. Key issues include violent crimes (19,827 cases), theft (12,711 incidents), and public order offences (5,360 cases), raising concerns about safety in the area.
#17- Birmingham

As the UK’s second-largest city and a hub of culture, arts, and industry in the West Midlands, Birmingham has much to offer. However, it also faces a high crime rate, recorded at 128.9 Crimes Per 1000 people. Violent crime is especially high, with 61,201 reported incidents, making it a major concern for residents. Theft follows closely with 46,871 cases, while vehicle offences (14,683 incidents) are also common.
#18- Leicester
Leicester is known for its winning football team and popularity as a place to live and work in the East Midlands. However, it also has a high crime rate of 125 Crimes Per 1000 Population. Key problems include violent crime (17,920 cases), theft (12,416 cases), and public order offences (5,992 cases), adding to residents’ safety worries.
#19- Hammersmith & Fulham
This area, famous for its sports and education scene in London, has a high crime rate of 124.8 Crimes Per 1000 Population, placing it among England and Wales’ more dangerous areas. Theft (11,551 cases), violent crime (5,909 cases), and vehicle crimes (3,187 cases) are significant issues here, making safety a top concern.
#20- Nottingham
Known for its link to the Robin Hood legend and as one of the fastest-growing cities in the UK, Nottingham has a crime rate of 124.6 Crimes Per 1000 Population. This rise in crime may reflect the city’s growing popularity. The main concerns here are theft (14,008 cases), violent crime (13,401 cases), and criminal damage (3,843 cases), which affect residents’ safety.
#21- Newcastle-upon-Tyne
Known as one of the main cities in the North East, Newcastle-upon-Tyne is famous for its vibrant nightlife and rich cultural heritage. However, this city also faces a high crime rate, recorded at 123.7 Crimes Per 1000 Population. Violent crime (13,217 incidents) and theft (13,005 incidents) are the leading concerns for residents and visitors. Another issue drawing attention is the increase in drug-related offences, with 1,193 incidents reported.
#22- Hackney
Hackney, a well-known borough in London, is often associated with its iconic Black Cabs and diverse residential areas. The borough has a crime rate of 123.3 Crimes Per 1000 Population, which reflects the dense population in the area. Theft is the most common problem here, with 15,205 reported cases, followed by violent crime at 8,702 cases. Vehicle-related offences are also high, with 2,586 incidents in the area.
#23- Calderdale
Situated in the heart of the Calder Valley, Calderdale is a picturesque area that includes the town of Halifax. Beneath its scenic views and natural beauty, however, Calderdale faces an increasing crime rate of 122.9 Crimes Per 1000 Population.
Violent crime alone (11,509 incidents) makes up nearly half of all crime in the area, which is a growing worry for residents. Theft (6,172 incidents) and public order offences (3,115 incidents) are also pressing issues, affecting the overall safety and security.
#24- Southwark
Southwark, one of London’s busiest boroughs, is known for its rich cultural landmarks, including the Shard and the historic Globe Theatre. Despite these attractions, Southwark has one of the capital’s highest crime rates at 122.8 Crimes Per 1000 Population.
Theft is especially common, with 19,692 reported cases, making it a primary concern for residents and tourists. Violent crime also remains high, with 9,136 incidents recorded, and criminal damage (2,154 cases) further adds to safety issues.
#25- Portsmouth
Portsmouth, famed for its iconic harbour and maritime history, unfortunately also ranks among England’s more dangerous cities, with a crime rate of 122.8 Crimes Per 1000 Population.
The city faces notable challenges in violent crime, with 10,475 reported cases, making it one of the top concerns for residents.
How does England compare to other Cities in UK?
| City Name | Total Crimes | Crime Rate | Rate Difference |
|---|---|---|---|
| Birmingham | 134,813 | 129 | 48% more dangerous |
| Bournemouth | 27,367 | 83 | 4.6% safer |
| Bradford | 46,766 | 145 | 66% more dangerous |
| Brighton and Hove | 28,770 | 109 | 25% more dangerous |
| Bristol | 59,485 | 131 | 50% more dangerous |
| Coventry | 37,405 | 117 | 34% more dangerous |
| Sheffield | 53,295 | 103 | 18% more dangerous |
| Derby | 31,033 | 119 | 37% more dangerous |
| Liverpool | 62,912 | 124 | 43% more dangerous |
| Leeds | 90,610 | 140 | 61% more dangerous |
| Kingston upon Hull | 36,008 | 133 | 53% more dangerous |
| Leicester | 44,522 | 125 | 44% more dangerous |
| Luton | 19,316 | 95 | 9% more dangerous |
Summary of Crimes in England 2024
| Type Of Crime | Count in England | Crime Rates |
| Anti-Social Behaviour | 843,643 | 16 |
| Bicycle Theft | 54,786 | 1.03 |
| Burglary | 229,890 | 4.34 |
| Criminal Damage and Arson | 410,371 | 7.75 |
| Drugs | 149,766 | 2.83 |
| Other Crime | 105,907 | 2.00 |
| Other Theft | 408,169 | 7.71 |
| Possession of Weapons | 49,443 | 0.93 |
| Public Order | 381,098 | 7.20 |
| Robbery | 72,907 | 1.38 |
| Shoplifting | 427,855 | 8.08 |
| Theft From the Person | 125,445 | 2.37 |
| Vehicle Crime | 335,173 | 6.33 |
| Violence and Sexual Offences | 1,854,178 | 35 |
Key Trends in Crime across England & Wales
As we’ve seen, crime remains a major issue across England and Wales, but there are some positive changes. Overall crime numbers have dropped slightly, with a 1% decrease in total offences. In the last year, the number of crime incidents that happened in England and Wales was 5,494,256 which is slightly lesser than the previous year’s offences which were 5,527,664.
Is Crime Rate Increasing in England & Wales?
Looking closer, some types of crime have seen noticeable declines.
-
Public Order Offences – Down 13% (from 592,323 to 516,611 cases)
-
Bicycle Theft – Down 12% (from 77,876 to 68,612 cases)
-
Stalking & Harassment – Down 6% (from 707,267 to 663,526 cases)
-
Criminal Damage – Down 5% (from 534,481 to 508,936 cases)
-
Violent Crime – Down 3% (from 2,112,624 to 2,049,254 cases)
However, other crimes are on the rise, posing new challenges:
-
Shoplifting – Up 36% (from 315,040 to 430,104 cases)
-
Theft from Individuals – Up 18% (to 125,563 cases)
-
Robbery – Up 13% (to 81,094 cases)
-
Weapon Possession – Up 8% (to 58,989 cases)
While reductions in some offences are encouraging, the surge in theft and violent crimes highlights the ongoing need for improved security measures. These growing numbers remain concerning for the public and authorities alike.
How Common Are Weapon Offences Across England & Wales?
Weapon-related crimes remain a serious issue in England and Wales, with an unfortunate rise over the past year. As mentioned earlier, overall weapon possession offences increased by 8%.
Focusing specifically on types of weapons, knife-related crimes went up by 7%, increasing from 46,153 incidents in 2022 to 49,489 incidents in 2023. Gun-related offences rose even more, with a 9% increase, going from 5,850 cases in 2022 to 6,367 cases in 2023. These numbers highlight the growing concerns around weapon-related incidents in the region.
Frequently Asked Questions (FAQs)
1- What city in the UK has the highest crime rate?
Westminster has the highest crime rate in England and Wales with 440 crimes per 1000 population. The area struggles with extremely high levels of theft (65,020 cases), violent crimes (11,958), vehicle offences (4,503), and public order offences (4,024). These statistics from official UK Police data confirm Westminster as the most dangerous place to live in England and Wales.
2- Has crime in England and Wales gone up or down recently?
The overall crime rate in England and Wales has decreased by a small margin of 1% in the last 12 months. The total number of criminal offences recorded was 5,494,256 compared to 5,527,664 in the previous year. While this shows a modest improvement, certain categories like shoplifting have increased significantly (by 36%), which remains a concern for residents and authorities.
3- Which crimes are most common across England and Wales?
The most common crimes in England and Wales are violent crimes (2,049,254 cases), followed closely by theft (1,789,462 cases). Other prominent offences include public order crimes (516,661), shoplifting (430,104), theft from the person (125,563), robberies (81,094), and weapon possession (58,989). These statistics highlight the diverse nature of criminal activities across these regions.
4- Are weapon-related crimes increasing in England and Wales?
Yes, weapon-related crimes are showing a concerning upward trend. Weapon possession offences increased by 8% over the past year. Breaking this down further, knife-related crimes rose by 7% (from 46,153 to 49,489 incidents) and gun-related offences increased by 9% (from 5,850 to 6,367 cases). This growing trend highlights the serious nature of weapon offences in the region.
5- Which areas in London have the highest crime rates?
London contains several of England and Wales’ most dangerous areas, with Westminster leading at 440 crimes per 1000 population. Camden follows with 184.2, while Kensington & Chelsea (160.4), Islington (131.5), and Hackney (123.3) also have concerning crime rates. Southwark and Hammersmith & Fulham also feature in the top dangerous areas with rates of 122.8 and 124.8 respectively.
6- What preventive measures can businesses take to improve security in high-crime areas?
Businesses in high-crime areas should consider implementing comprehensive security measures including hiring professional security guarding services to maintain constant vigilance, employing mobile patrol services that visit premises at random intervals to deter potential intruders, and installing CCTV camera systems for continuous monitoring. These combined approaches create multiple layers of protection against the various threats businesses face.
7- How does Manchester compare to other dangerous areas in England and Wales?
Manchester ranks as the third most dangerous area in England and Wales with a crime rate of 172.6 crimes per 1000 population. The city faces significant challenges with violent crimes (33,253 cases), theft (32,266), public order offences (11,612), and criminal damages (7,605). As a highly populated area, Manchester’s crime statistics reflect serious security concerns for both residents and visitors.
8- Which types of crimes have seen the biggest decrease in England and Wales?
Several crime categories have shown encouraging decreases. Public order offences dropped by 13% (from 592,323 to 516,611 cases), and bicycle theft decreased by 12% (from 77,876 to 68,612 incidents). There were also reductions in stalking and harassment (down 6%), criminal damage (down 5%), and violent crime (down 3%). These decreases represent positive trends in certain aspects of public safety.
9- Which crimes have increased the most in England and Wales?
Shoplifting has seen the most dramatic increase with a 36% rise, jumping from 315,040 to 430,104 incidents in the past year. Theft from individuals increased by 18% (to 125,563 cases), robbery rose by 13% (to 81,094 cases), and weapon possession grew by 8% (to 58,989 cases). These significant increases highlight evolving crime patterns that require targeted prevention strategies.
10- Why is Blackpool considered one of the most dangerous areas in England and Wales?
Blackpool ranks as the sixth most dangerous area with a crime rate of 157.3 crimes per 1000 population. The seaside town is particularly troubled by violent crimes (9,703 cases), theft (6,309), and criminal damages (2,283). Despite its reputation as a holiday destination, Blackpool faces serious safety challenges that affect both residents and visitors, contributing to its position among the top dangerous areas.
How to Stay Safe in England & Wales: Practical Tips
Here are some of the preventive measures you can take to ensure your business is always safe and secure:
Security Guarding Services
At Guard Mark Security, we suggest you hire a security guarding service for your business to make sure everyone is safe and secure all the time while working for you.
Mobile Patrol Services
Hire mobile patrol services and ask them to visit your premises without following any pattern. This helps intruders and vandals keep away from your business premises.
CCTV Cameras
We are living in a digitalised era where having CCTV cameras is crucial to enhance the safety and security of your business. Install the CCTV cameras and monitor them closely all the time.
Ideal Security Guarding Services in England and Wales
Guard Mark Security has been providing security services for over a decade in England and Wales and helped hundreds of businesses by providing security services.
From manned guarding and door supervision to Mobile patrol to CCTV surveillance we are able to fulfil all your security needs and requirements. Contact us now to get your desired services in a cost-effective and affordable package.
Conclusion: Most Dangerous Areas in England and Wales
The crime landscape across England and Wales presents a complex picture with both concerning trends and positive developments. While the overall crime rate has slightly decreased by 1%, certain areas continue to face significant security challenges. Westminster remains the most dangerous area with an alarming crime rate of 440 per 1000 population, followed by Camden and Manchester with rates of 184.2 and 172.6, respectively.
The nature of crime is evolving, with shoplifting seeing a dramatic 36% increase and weapon-related offences continuing to rise. Knife crimes increased by 7% and gun-related offences by 9%, highlighting growing concerns about public safety. Conversely, some categories have shown improvement, with public order offences dropping by 13% and bicycle theft declining by 12%.
The data presented in this analysis comes directly from official UK Police reports and represents the most current information available. By staying informed about crime trends and taking appropriate preventive measures, individuals and businesses can better protect themselves against the prevalent security threats in their areas. Remember, both good and bad are parts of these places, and being aware of the risks is the first step toward ensuring safety and security.