
Being aware of crime rates in your area is essential for ensuring the safety of your family, business, and property. Understanding these statistics helps you take preventive measures and choose the best keyholding services in London.
In this blog, we’ll highlight the 15 most dangerous areas in London using the latest crime data from the Metropolitan Police Service (Dec 2023 – Feb 2025). This publicly available data provides insights into London’s evolving safety landscape.
London, a vibrant and diverse city, attracts millions of visitors annually. With a population of approximately 9.75 million in 2024 and an expected rise to 9.8 million in 2025, the city offers vast opportunities but also faces security challenges. In the first half of 2024 alone, over 10.4 million tourists visited, making public safety a crucial concern.
Key Takeaways
-
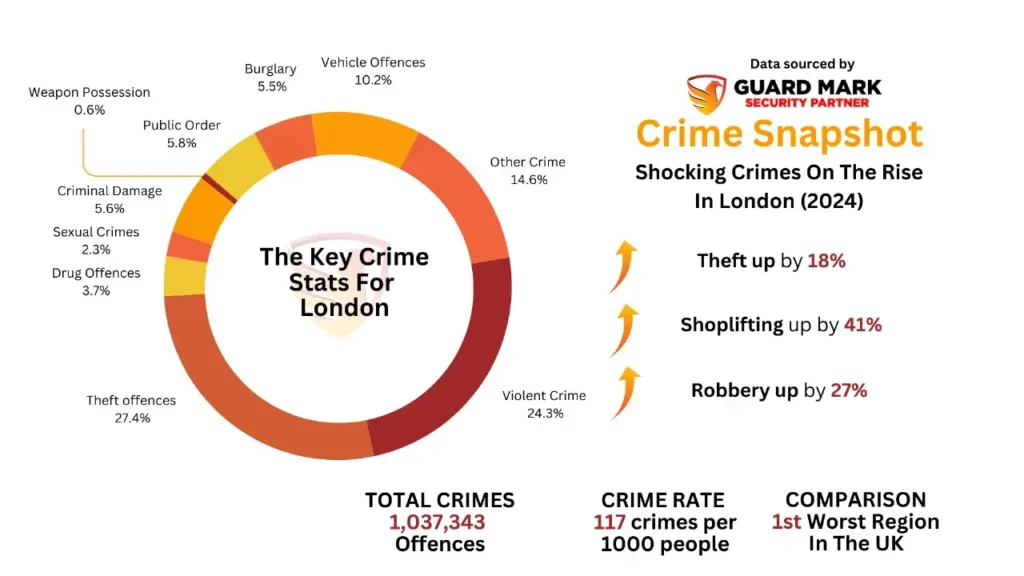
Overall Crime Rates: 117 crimes per 1000 population.
-
Most Dangerous Areas in London include Westminster ( 440.7 Crimes Per 1,000 People) and Camden (212.3 Crimes Per 1,000 People)
Table of Contents
How Do We Source the Data?
At Guard Mark Security, we always provide authentic and legitimate data to ensure transparency. In this blog, we have used multiple public sources including:
Moreover, all the data and the crime statistics we have mentioned in the blog for the cities and towns are from December 2023 to February 2025. You can verify the data by visiting the linked sources.
Additionally, to give you a clear understanding of the crime rates, we have mentioned the crime rates by dividing them per 1,000 residents. If you have any questions or queries, you can reach us via comments or email.
What are the Most Common Crimes in London?
We all know that good and bad are both parts of life. At every place where good people exist, bad people also do. Undoubtedly, London is the capital and the business hub for the country but there are also some issues that London has been facing for a long time.
Crime rate is one of them and today we’ll discuss the top 15 places with the highest crimes rates and illegal activities. But before discussing the areas one by one, let’s take a look at the overall crime rate in London. According to the most recent publicly available data, the crime rate in London is 117 crimes per 1000 population.
-
Theft: 395,885 incidents
-
Violence Against the Person: 295,042 incidents
-
Vehicle Crimes: 125,647 incidents
-
Drug Offences: 51,044 incidents
So now that you know what kinds of crimes are most common in London, let’s take a look at the worst areas and their crime rates.
Key Insights into Crime in the City of London in 2025
One thing you should keep in mind while reading this blog is that we haven’t included the district of London in our list of the top 15 worst areas in London. The reason is that only 10,800 people live there permanently, but over half a million people are working there. This is the reason the crime rate in the district is so high.
There were over 7,622 criminal offences happened in the city of London as compared to the last year, which means the crime rate in the city of London is 705.7 per 1000 population. But these criminal and illegal activities are usually performed by the outsiders who work there. For this sole reason, we haven’t included the city of London in our list of the top worst areas of London.
Also Read: The 15 Safest Boroughs in London for 2025
Is London Safe?
London undoubtedly is one of the most important cities in England and is known for its opportunistic nature and development. But when looking at the crime statistics, London has the highest number of crimes in the whole of the UK and crime is increasing with every passing year.
In fact, according to statistics, in 2023/24, London faced 938,020 criminal and illegal activities, which is the highest in the history of London. London provides multiple business opportunities, but at the same time, it has a soaring crime rate as well.
So, if you’re planning to visit London, you should. But, make sure to take all necessary security precautions so you don’t have to deal with unpleasant situations.
So, which are the most dangerous places in London? Let’s take a closer look.
Revealed: Top 15 Most Dangerous Areas in London
| Areas in London | Overall Crime Rate |
|---|---|
| 1- Westminster | 440.7 Crimes Per 1,000 People |
| 2- Camden | 212.3 Crimes Per 1,000 People |
| 3- Kensington & Chelsea | 179.0 Crimes Per 1,000 People |
| 4- Islington | 137.0 Crimes Per 1,000 People |
| 5- Southwark | 157.5 Crimes Per 1,000 People |
| 6- Hackney | 146.4 Crimes Per 1,000 People |
| 7- Hammersmith & Fulham | 143.8 Crimes Per 1,000 People |
| 8- Newham | 142.0 Crimes Per 1,000 People |
| 9- Tower Hamlets | 141.0 Crimes Per 1,000 People |
| 10- Lambeth | 140.0 Crimes Per 1,000 People |
1- Westminster
-
Crime Rate: 440.7 Crimes Per 1,000 People
-
Total Reported Crimes: 114,787

Westminster has the highest crime rate in London, primarily due to its busy tourist hotspots and vibrant nightlife. The influx of visitors makes it a prime target for opportunistic crimes.
The Most Common and Prominent Crimes in Westminster
-
Theft: 74,726 incidents
-
Violence Against the Person: 13,546 incidents
-
Vehicle Offences: 5,324 incidents
-
Robberies: 4,770 cases
-
Drug Offences: 2,752 incidents
2- Camden
-
Crime Rate: 212.3 Crimes Per 1,000 People
-
Total Reported Crimes: 52,655
Camden is famous for its rich history, culture, and counter-culture scenes. People also visit Camden to enjoy live music at The Roundhouse and explore the markets, but it also experiences a high crime rate due to its popularity among tourists and locals.
The Most Common and Prominent Crimes in Camden
-
Theft: 26,682 incidents
-
Violence Against the Person: 8,788 offences
-
Vehicle Offences: 3,686 incidents
-
Burglary: 2,925 cases
-
Drug Offences: 1,866 incidents
3- Kensington & Chelsea
-
Crime Rate: 179.0 Crimes Per 1,000 People
-
Total Reported Crimes: 28,239
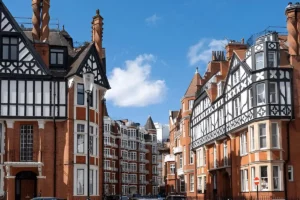
Despite its reputation as one of London’s wealthiest boroughs, Kensington & Chelsea faces significant crime levels due to its affluent residents and high-value targets.
The Most Common and Prominent Crimes in Kensington & Chelsea
-
Theft: 11,630 incidents
-
Vehicle Offences: 3,426 cases
-
Burglary: 1,848 incidents
-
Drug Offences: 1,034 incidents
-
Robberies: 876 cases
-
Sexual Offences: 685 incidents
4- Islington
-
Crime Rate: 137.0 Crimes Per 1,000 People
-
Total Reported Crimes: 37,508
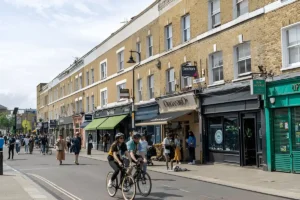
Islington is one of the renowned boroughs in the north of London, famous for its passion for art and culture. There are vibrant streets and independent shopping opportunities where you can buy your desired products of excellent quality.
However, it continues to face safety challenges.
The Most Common and Prominent Crimes in Islington
-
Theft: 14,978 incidents
-
Violence Against the Person: 8,420 incidents
-
Vehicle Offences: 3,067 cases
-
Public Order Offences: 2,332 incidents
-
Burglary: 2,189 incidents
-
Robberies: 1,504 incidents
5- Southwark
-
Crime Rate: 157.5 Crimes Per 1,000 People
-
Total Reported Crimes: 48,768
Southwark is one of the places tourists visit for the sake of art, culture, and architectural designs. If you’re an art lover; Tate Modern, Hayward Gallery, and Dulwich Picture Gallery are the places for you. If you are going to explore the culture, Southwark Cathedral, The Clink Prison Museum, and Siobhan Davies Dance are the places you should go. Now last but not least, if you are looking for architectural designs; Peckham Library, City Hall, and The Shard at London Bridge are enough to blow your mind.
The Most Common and Prominent Crimes in Southwark
-
Theft: 20,430 incidents
-
Violence Against the Person: 10,313 incidents
-
Vehicle Offences: 3,482 incidents
-
Burglary: 3,020 incidents
-
Robberies: 2,586 incidents
6- Hackney
-
Crime Rate: 128.7 Crimes Per 1,000 People
-
Total Reported Crimes: 41,209
Hackney is well known for its art, cultural diversion, and lush green spaces which makes Hackney one of the most popular tourist destinations in London. There are many other places Hackney is known for including community, nightlife, transportation, food, and more. Some notable places in Hackney are Queen Elizabeth Olympic Park, Victoria Park, Hackney Marshes, and Geffrye Museum.
The Most Common and Prominent Crimes in Hackney
-
Theft: 14,977 incidents
-
Violence Against the Person: 9,865 incidents
-
Vehicle Offences: 3,190 incidents
-
Burglary: 2,741 incidents
-
Public Order Offences: 2,580 incidents
-
Drug Offences: 1,866 incidents
-
Robberies: 2,174 incidents
7- Hammersmith & Fulham
-
Crime Rate: 143.8 Crimes Per 1,000 People
-
Total Reported Crimes: 26,460
Hammersmith & Fulham is one of the most popular places for football lovers and is the house of 3 great and well-known football clubs. When talking about art and entertainment; Hammersmith Apollo, Television Centre, Music companies, and Concert and exhibition halls are the places you can visit. There are many other places including Hammersmith Bridge and Ark office building you can visit for the sake of architecture.
The Most Common and Prominent Crimes in Hammersmith & Fulham
-
Theft: 8,413 incidents
-
Violence Against the Person: 6,953 incidents
-
Vehicle Offences: 2,593 incidents
-
Public Order Offences: 2,003 incidents
-
Drug Offences: 1,330 incidents
-
Burglary: 1,706 incidents
8- Newham
-
Crime Rate: 142.0 Crimes Per 1,000 People
-
Total Reported Crimes: 50,129

People remember Newham for the 2012 Olympics cause it was hosted there and now the area is famous for the sporting events. One of the most popular shopping malls; Westfield Stratford is also in Newham that grabs the attention of many tourists. Newham is also famous for its notorious gangs and other criminal activities.
The Most Common and Prominent Crimes in Newham
-
Theft: 17,823 incidents
-
Violence Against the Person: 12,184 incidents
-
Vehicle Offences: 5,525 incidents
-
Drug Offences: 2,827 incidents
-
Public Order Offences: 2,561 incidents
-
Burglary: 2,461 incidents
9- Tower Hamlets
-
Crime Rate: 141.1 Crimes Per 1,000 People
-
Total Reported Crimes: 44,764
Tower Hamlets is also known as the Heart of the East End and has iconic landmarks including the Tower of London and Tower Bridge. When talking about the markets and the shopping places; Brick Lane Market and Columbia Road Flower Market are places you can visit to spend some quality time with your loved ones. There are many other places you can visit for the sake of entertainment and exploration.
The Most Common and Prominent Crimes in Tower Hamlets
-
Theft: 13,546 incidents
-
Violence Against the Person: 12,139 incidents
-
Drug Offences: 2,784 incidents
-
Vehicle Offences: 3,919 incidents
-
Burglary: 3,052 incidents
-
Robberies: 1,778 incidents
10- Lambeth
-
Crime Rate: 140.0 Crimes Per 1,000 People
-
Total Reported Crimes: 46,821
Lambeth is well known and famous for its rich history, culture, and iconic landmarks that instantly grab the visitor’s attention. When talking about the famous landmarks of Lambeth, Lambeth Palace, London Eye, Brixton Windmill, Oval Cricket Ground, Newport Street Gallery, Imperial War Museum, Florence Nightingale Museum, and Old Vic are the places you can visit and explore.
The Most Common and Prominent Crimes in Lambeth
-
Theft: 16,209 incidents
-
Vehicle Offences: 4,345 incidents
-
Public Order Offences: 2,815 incidents
-
Robberies: 2,783 incidents
-
Burglary: 2,546 incidents
11- Haringey
-
Crime Rate: 122.4 Crimes Per 1,000 People
-
Total Reported Crimes: 34,811
Haringey is well known and famous for many landmarks including the historic Bruce Castle Museum, beautiful Finsbury Park, and the world-class Tottenham Hotspur Stadium. Haringey is also home to the famous Tottenham Hotspur Football Club. One of the places that attracts many visitors is Alexandra Palace also known as Ally Pally. The region also has many green spaces that enhance its beauty.
The Most Common and Prominent Crimes in Haringey
-
Theft: 9,869 incidents
-
Violence Against the Person: 9,046 incidents
-
Vehicle Offences: 4,505 incidents
-
Drug Offences: 1,876 incidents
-
Public Order Offences: 2,093 incidents
-
Burglary: 2,085 incidents
12- Greenwich
-
Crime Rate: 119.5 Crimes Per 1,000 People
-
Total Reported Crimes: 34,214

Greenwich is one of the most picturesque riverside cities in London where people love to spend quality time with their loved ones. Also, the riverside hotels in the city provide comfortable accommodations to tourists with the most amazing views in the world. When talking about maritime history, you can visit places like Greenwich Meridian, Greenwich Mean Time, Cutty Sark, and the National Maritime Museum. Moreover, the history-related places here are the Royal Observatory Greenwich, Queen’s House, Ranger’s House, and The Fan Museum.
The Most Common and Prominent Crimes in Greenwich
-
Violence Against the Person: 10,800 incidents
-
Theft: 8,180 incidents
-
Vehicle Offences: 3,645 incidents
-
Drug Offences: 1,901 incidents
-
Public Order Offences: 2,407 incidents
13- Lewisham
-
Crime Rate: 118.7 Crimes Per 1,000 People
-
Total Reported Crimes: 36,844
Lewisham is famous for its history, culture, many iconic landmarks, and green spaces including Manor House Gardens, Blackheath Common, Beckenham Place Park, and Sydenham Garden. Moreover, while exploring the history of Lewisham, you can look at the Battle of Lewisham, Horniman Museum and Gardens, and Deptford.
The Most Common and Prominent Crimes in Lewisham
-
Violence Against the Person: 11,134 incidents
-
Theft: 9,185 incidents
-
Vehicle Offences: 4,040 incidents
-
Drug Offences: 2,027 incidents
-
Burglary: 2,185 incidents
-
Robberies: 1,291 incidents
14- Brent
-
Crime Rate: 118.5 Crimes Per 1,000 People
-
Total Reported Crimes: 39,904

Brent is one of the famous boroughs in the Northwest of London famous for its major attributes like Wembley Stadium, BAPS Shri Swaminarayan Mandir (Neasden Temple), Cultural diversity, and Kiln Theatre.
There are multiple sites and places you can visit in Brent and spend some quality time while exploration. Brent is full of commercial areas and people with different cultures and ethnicities.
The Most Common and Prominent Crimes in Brent
-
Violence Against the Person: 11,512 incidents
-
Theft: 11,108 incidents
-
Vehicle Offences: 4,508 cases
-
Drug Offences: 2,161 incidents
-
Burglary: 2,448 incidents
-
Robberies: 1,395 incidents
15- Hounslow
-
Crime Rate: 117.7 Crimes Per 1,000 People
-
Total Reported Crimes: 32,704

Hounslow is famous for its famous greenspaces and Heathrow Airport which makes it one of the most comfortable and convenient places for tourists and visitors. The key points about Hounslow are Heathrow Airport, Historic Parks, Hounslow Heath, and the Diverse Community.
The diverse community experience gives visitors a new experience about knowing and exploring different cultures.
The Most Common and Prominent Crimes in Hounslow
-
Violence Against the Person: 10,406 incidents
-
Theft: 8,103 incidents
-
Vehicle Offences: 4,081 incidents
-
Arson and Criminal Damage: 2,382 incidents
-
Burglary: 1,918 incidents
-
Drug Offences: 1,268 incidents
Knife Crime In London – Top 10 areas for knife crime in London

As you, we have mentioned the top 1 most dangerous areas in London and shared the crime statistics with you. Now let’s explore some statistics about knife crime in London. Knife and sharp object crime in London is increasing by a huge margin. The total knife crime count in London from Dec 2023 to Dec 2024 is 17,058 incidents and the knife crime rate has increased by 7.0% in the last 12 months period. ( See: Is Knife Crime in UK Schools on the Rise? ).
When talking about the top 10 areas for knife crime in London, here are the areas with the most number of crimes:
-
Westminster: 986 knife crimes in the last 12 months (3.8 knife crimes per 1,000 residents)
-
Lambeth: 999 knife crimes in the last 12 months (3.0 knife crimes per 1,000 residents)
-
Southwark: 847 knife crimes in the last 12 months (2.6 knife crimes per 1,000 residents)
-
Haringey: 729 knife crimes in the last 12 months (2.6 knife crimes per 1,000 residents)
-
Barking & Dagenham: 540 knife crimes in the last 12 months (2.5 knife crimes per 1,000 residents)
-
Newham: 873 knife crimes in the last 12 months (2.5 knife crimes per 1,000 residents)
-
Hackney: 682 knife crimes in the last 12 months (2.4 knife crimes per 1,000 residents)
-
Camden: 583 knife crimes in the last 12 months (2.4 knife crimes per 1,000 residents)
-
Tower Hamlets: 698 knife crimes in the last 12 months (2.2 knife crimes per 1,000 residents)
-
Croydon: 857 knife crimes in the last 12 months (2.2 knife crimes per 1,000 residents)
Safety Tips and Recommendations for London’s Residents & Businesses
We know it’s difficult to live in a place with a high crime rate and illegal activities, but there are some tips and recommendations you can use or adapt to make sure everything is safe around you. Here are some of them:
Personal Safety
-
Carry Safety Gear: Equip yourself with pepper spray, a personal alarm, or a folding steel stick.
-
Avoid Isolated Routes: Stick to well-lit, busy streets, especially at night.
-
Stay Alert: Be aware of your surroundings and avoid distractions like excessive phone use.
Property Safety
-
Install Security Systems: Use CCTV cameras, alarms, and motion detectors to protect your home or business.
-
Secure Entry Points: Invest in high-quality locks and smart security systems.
Business Safety
-
Hire Professional Security: Companies like Guard Mark Security provide SIA-licenced guards to protect your premises.
-
Regular Risk Assessments: Identify vulnerabilities and implement preventive measures.
So these are some of the things that you can use and adopt for the sake of your and your business’s safety in London.
Ideal Security Guarding Company in London
Guard Mark Security is one of the most well-known and reputed security guard companies in London and has helped hundreds of businesses ensure the safety and security of their employees, customers, and premises. All of our security guards are SIA licenced and are vetted per BS7858 Standards.
Worried about safety in London?
If you are looking for a professional company that can take care of all your security needs, Guard Mark is the one. Contact us to get more information related to our services. Our friendly and knowledgeable team is here 24/7 to answer all your queries in the best manner. Let’s make London a safer place together.
Conclusion
While London offers incredible opportunities and experiences, it’s essential to stay informed about crime trends and take proactive steps to ensure safety. By understanding the risks and implementing effective security measures, you can protect yourself, your loved ones, and your property.
Stay safe, stay vigilant, and let’s work together to create a safer London.