
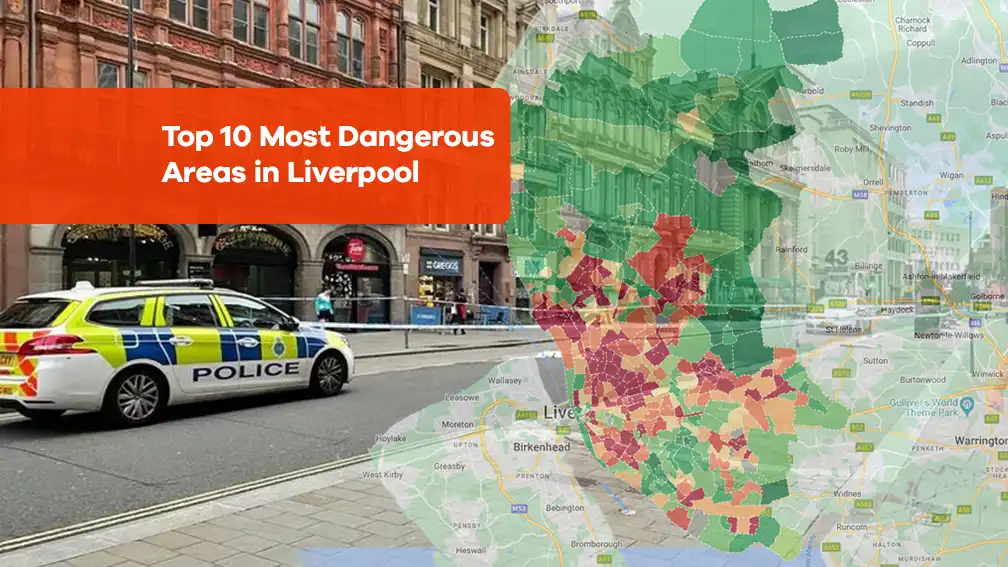
Liverpool is generally known for its culture and heritage. We often read or hear bad things about Liverpool City, about the violent crimes and fights. But the question that arises here is, is Liverpool really that bad to be lived? Other people and tourists know Liverpool due to the large number of bars, pubs, and football clubs there. Liverpool’s football clubs are recognised at the international level and have a huge fan following.
But there are several areas where the crime rate is high and people are facing huge challenges to improve their living standards there. But before discussing the roughest part of Liverpool, let’s discuss is living in Liverpool really dangerous.
Moreover, if you are living in London and want to know crime stats, check out our latest blog “Top 15 Most Dangerous Areas in London A Guide to Safety and Awareness” for the sake of improving your safety and security.
Key Takeaways
-
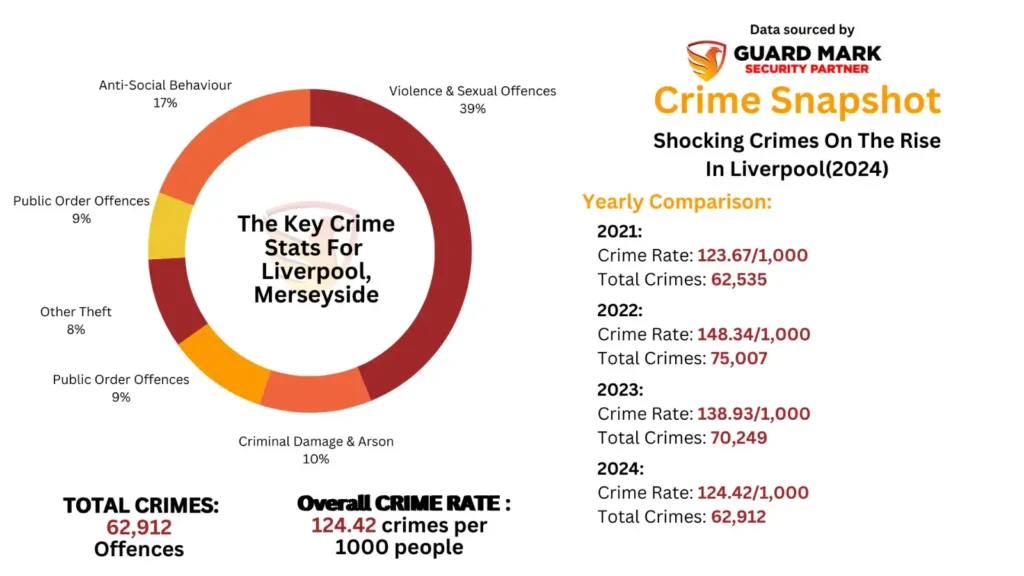
Liverpool’s Crime Rate: The overall crime rate in Liverpool in 2024 is 124.42 crimes per 1,000 people.
-
The police have recorded almost 62,912 criminal offences and incidents in Liverpool in 2024.
-
High Crime Areas: City Centre North, Brownlow Hill, Waterfront South, City Centre South, and Everton West have the highest crime rates in Liverpool.
-
Common Crimes: Violence, sexual offences, public order issues, and theft are prevalent.
-
Some of the safest areas in Liverpool are Calderstones, Mossley Hill, Aigburth, Grassendale & Cressington, and Childwall.
-
Safety Tips: Use personal alarms, secure properties with CCTV, and choose well-lit routes.
-
Security Services: Guard Mark Security offers tailored services like mobile patrols and on-site security for businesses and residents in high-risk areas.
- Key Takeaways
- Is Liverpool One of the Most Dangerous Areas in Merseyside?
- Is Liverpool Safe?
- What are the Most Dangerous Areas in Liverpool?
- What Are the Safest Areas in Liverpool?
- How Does Liverpool Compare to Other UK Cities?
- Summary of Crimes in Liverpool
- How to Stay Safe in Liverpool?
- How Has Guard Mark Security Sourced This Data?
- Frequently Asked Questions (FAQs)
- 1- What is the overall crime rate in Liverpool?
- 2-Is Liverpool Safe?
- 3- Which areas in Liverpool have the highest crime rates?
- 4- What are the most common types of crimes in the areas with the highest crime rates in Liverpool?
- 5- Which areas are considered the safest in Liverpool based on crime rates?
- 6- What types of crimes are most common in the safest areas of Liverpool?
- 7- If I am considering moving to Liverpool, which areas should I consider for safety and security?
- 8- Does a high crime rate in an area like City Centre North mean it’s unsafe to visit for tourists?
- 9- Are there any specific times of day or days of the week when crime is more likely in the high-crime areas?
- Best Security Guarding Services in Liverpool
Is Liverpool One of the Most Dangerous Areas in Merseyside?
Liverpool has a negative reputation in the main media and often comes under headlines due to increased crime rates and illegal activities. In fact, it is one of the most dangerous areas in Merseyside and saves a spot when talking about the top 10 most dangerous areas in Merseyside.
In 2023, the overall crime rate of the area was 135 crimes per 1,000 people which was even 26% higher than the overall crime rate of Merseyside. According to the CrimeRate, March 2024 was the worst month for Liverpool’s residents, with 54 reported robberies in just a month.
How Has Liverpool’s Crime Rate Changed Over the Past Four Years?
-
2021: 123.67 crimes per 1,000 people (62,535 total crimes)
-
2022: 148.34 crimes per 1,000 people (75,007 total crimes)
-
2023: 138.93 crimes per 1,000 people (70,249 total crimes)
-
2024: 124.42 crimes per 1,000 people (62,912 total crimes)
What Are the Most Common Crimes in Liverpool?
| Crime Type | Total Crimes |
|---|---|
| Violence & Sexual Offences | 25,201 |
| Public Order | 7,223 |
| Anti-Social Behaviour | 6,414 |
| Drugs | 6,382 |
| Criminal Damage & Arson | 5,458 |
| Shoplifting | 4,891 |
| Other Theft | 4,396 |
| Vehicle Crime | 2,979 |
| Burglary | 2,183 |
| Other Crimes | 1,560 |
| Theft from the Person | 998 |
| Robbery | 564 |
| Possession of Weapons | 554 |
| Bicycle Theft | 523 |
For a more detailed look into the specific areas with the highest crime rates, check out our Most Dangerous Areas in Manchester blog post. This post breaks down the hotspots, helping you stay informed and aware of the safety concerns in the city.
Is Liverpool Safe?
In a survey conducted by confused.com in 2021, Liverpool was voted as one of the safest cities in the UK to live in. In that survey, there were 32 different factors being analysed including the crime report, the number of police officers in the city, the number of operational CCTV cameras, and resident safety. Moreover, in that survey, the team analysed and asked questions to 32 different city residents. Shockingly, a large number of Liverpool residents said that they feel safe and secure in the city. Also, Liverpool had the largest amount of operational CCTV cameras in the city out of the other 32 being surveyed.
But one thing that the survey showed was Liverpool had the least number of active police officers in the city which means there is a high chance for criminals to perform criminal or illegal activities that can disturb the peace of the area easily. But, one thing to consider here is the crime rate in Liverpool is comparatively lower than the national average.
So, before discussing some of the roughest places in Liverpool, if you are a business owner and concerned about the security of your premises, hiring a security guard can be one of the most effective ways to deter crime and maintain peace of mind.
Guard Mark Security is here to help you safeguard your property with expert and professional security guarding services in Liverpool. Contact us today to hire a security guard and protect your business with confidence. Now, let’s discuss the top 10 most dangerous areas in Liverpool.
Note: All of these stats are available publicly on the Merseyside police website, and you can confirm by visiting their website.
What are the Most Dangerous Areas in Liverpool?
Here is the list of the top 10 roughest parts of Liverpool. Please review them carefully before making up your mind to move to any of these.
1- City Centre North
Overall Crime Rate: 742 Crimes Per 1,000 People
City Centre North is one of the well-defined and famous districts in Liverpool, mostly known for its historical significance, Liverpool ONE, the Cavern Quarter, Proximity to the Waterfront, and more. When looking at the crime rate in City Centre North, it’s the highest in the whole of Liverpool: 742 crimes per 1,000 people, making it the worst place to live or to do business in Liverpool.
What are the most common crimes in City Centre North?
Here is the list of the most common and prominent crimes that happened in City Centre North (Mar 2024 – Feb 2025):
-
Violence and sexual offences: 206 Crimes Per 1,000 People
-
Shoplifting: 111 Crimes Per 1,000 People
-
Drugs: 107 Crimes Per 1,000 People
-
Public order: 84.3 Crimes Per 1,000 People
-
Anti-social behaviour: 68.2 Crimes Per 1,000 People
-
Other theft: 56 Crimes Per 1,000 People
-
Criminal damage and arson: 30.5 Crimes Per 1,000 People
-
Theft from the person: 21.4 Crimes Per 1,000 People
-
Burglary: 16.8 Crimes Per 1,000 People
-
Vehicle crime: 11.7 Crimes Per 1,000 People
-
Robbery: 8.03 Crimes Per 1,000 People
-
Other crime: 7.24 Crimes Per 1,000 People
-
Bicycle theft: 7.07 Crimes Per 1,000 People
-
Possession of weapons: 6.86 Crimes Per 1,000 People
2- Brownlow Hill
Overall Crime Rate: 461 Crimes Per 1,000 People
Brownlow Hill is primarily known for its historical contributions and significance, including The Site of the Former Brownlow Hill Workhouse and Infirmary, Early Nurse Training, and Connection to Social History. The overall crime rate in Brownlow Hill is 461 crimes per 1,000 people, making it the 2nd most dangerous area in Liverpool.
What are the most common crimes in Brownlow Hill?
Here is the list of the most common and prominent crimes that happened in Brownlow Hill (Mar 2024 – Feb 2025):
-
Violence and sexual offences: 138 Crimes Per 1,000 People
-
Drugs: 62.4 Crimes Per 1,000 People
-
Shoplifting: 55.4 Crimes Per 1,000 People
-
Public order: 52.7 Crimes Per 1,000 People
-
Anti-social behaviour: 44.9 Crimes Per 1,000 People
-
Other theft: 36.7 Crimes Per 1,000 People
-
Criminal damage and arson: 19.3 Crimes Per 1,000 People
-
Burglary: 12.6 Crimes Per 1,000 People
-
Theft from the person: 12.2 Crimes Per 1,000 People
-
Bicycle theft: 6.19 Crimes Per 1,000 People
-
Vehicle crime: 6.02 Crimes Per 1,000 People
-
Robbery: 5.42 Crimes Per 1,000 People
-
Other crime: 5.29 Crimes Per 1,000 People
-
Possession of weapons: 3.95 Crimes Per 1,000 People
3- Waterfront South
Overall Crime Rate: 444 Crimes Per 1,000 People
Waterfront South is one of the famous parts of Liverpool mostly known for its Royal Albert Dock and its attractions, the M&S Bank Arena and ACC Liverpool as entertainment and conference venues, and the Liverpool Marina. Moreover, when looking at the overall crime rate in Waterfront South, it is 444 crimes per 1,000 people.
What are the most common crimes in Waterfront South?
Here is the list of the most common and prominent crimes that happened in Waterfront South (Mar 2024 – Feb 2025):
-
Violence and sexual offences: 125 Crimes Per 1,000 People
-
Drugs: 68.8 Crimes Per 1,000 People
-
Shoplifting: 61.9 Crimes Per 1,000 People
-
Public order: 40.5 Crimes Per 1,000 People
-
Anti-social behaviour: 40.1 Crimes Per 1,000 People
-
Other theft: 38.3 Crimes Per 1,000 People
-
Criminal damage and arson: 19.3 Crimes Per 1,000 People
-
Theft from the person: 15 Crimes Per 1,000 People
-
Burglary: 11.5 Crimes Per 1,000 People
-
Vehicle crime: 6.87 Crimes Per 1,000 People
-
Other crime: 5.69 Crimes Per 1,000 People
-
Robbery: 4.51 Crimes Per 1,000 People
-
Possession of weapons: 4.12 Crimes Per 1,000 People
-
Bicycle theft: 3.17 Crimes Per 1,000 People
4- City Centre South
Overall Crime Rate: 421 Crimes Per 1,000 People
City Centre South is one of the parts of Liverpool, Renowned for its extensive shopping, diverse dining, entertainment, modern architecture and design, and connectivity. The overall crime rate in City Centre South is 421 crimes per 1,000 people, making it the 4th most dangerous area in Liverpool.
What are the most common crimes in City Centre South?
Here is the list of the most common and prominent crimes that happened in City Centre South (Mar 2024 – Feb 2025):
-
Violence and sexual offences: 125 Crimes Per 1,000 People
-
Drugs: 79.5 Crimes Per 1,000 People
-
Shoplifting: 39.6 Crimes Per 1,000 People
-
Other theft: 35.4 Crimes Per 1,000 People
-
Public order: 34.6 Crimes Per 1,000 People
-
Anti-social behaviour: 31.2 Crimes Per 1,000 People
-
Criminal damage and arson: 23 Crimes Per 1,000 People
-
Theft from the person: 20 Crimes Per 1,000 People
-
Burglary: 12 Crimes Per 1,000 People
-
Vehicle crime: 6.27 Crimes Per 1,000 People
-
Other crime: 4.11 Crimes Per 1,000 People
-
Robbery: 3.98 Crimes Per 1,000 People
-
Possession of weapons: 3.7 Crimes Per 1,000 People
-
Bicycle theft: 2.23 Crimes Per 1,000 People
5- Everton West
Overall Crime Rate: 344 Crimes Per 1,000 People
Everton West is widely recognised for its association with Everton Football Club, Everton Park, Historical Significance, Everton Water Tower, Merseyside Police Headquarters, and Liverpool Hope University’s Creative Campus. When looking at the overall crime rate in Everton West, it is 344 crimes per 1,000 people, making it one of the most dangerous areas in Liverpool.
What are the most common crimes in Everton West?
Here is the list of the most common and prominent crimes that happened in Everton West (Mar 2024 – Feb 2025):
-
Violence and sexual offences: 83.2 Crimes Per 1,000 People
-
Public order: 51.9 Crimes Per 1,000 People
-
Drugs: 43.9 Crimes Per 1,000 People
-
Anti-social behaviour: 40 Crimes Per 1,000 People
-
Other crimes: 37.6 Crimes Per 1,000 People
-
Shoplifting: 23.7 Crimes Per 1,000 People
-
Criminal damage and arson: 22.7 Crimes Per 1,000 People
-
Other theft: 16.6 Crimes Per 1,000 People
-
Vehicle crime: 7.72 Crimes Per 1,000 People
-
Burglary: 5.34 Crimes Per 1,000 People
-
Bicycle theft: 3.21 Crimes Per 1,000 People
-
Robbery: 3.12 Crimes Per 1,000 People
-
Possession of weapons: 2.8 Crimes Per 1,000 People
-
Theft from the person: 2.3 Crimes Per 1,000 People
6- Vauxhall
Overall Crime Rate: 273 Crimes Per 1,000 People
Vauxhall is one of the popular areas in Liverpool and is widely known for its Scottie Road, Irish Heritage, Historic Churches, Eldon Grove, Boys from the Blackstuff, and The Scottie Press. When discussing the overall crime rate in Vauxhall, it is 273 crimes per 1,000 people, which is considered high.
What are the most common crimes in Vauxhall?
Here is the list of the most common and prominent crimes that happened in Vauxhall (Mar 2024 – Feb 2025):
-
Violence and sexual offences: 73.9 Crimes Per 1,000 People
-
Anti-social behaviour: 43.9 Crimes Per 1,000 People
-
Other crimes: 29.4 Crimes Per 1,000 People
-
Public order: 28.8 Crimes Per 1,000 People
-
Drugs: 22.1 Crimes Per 1,000 People
-
Criminal damage and arson: 20.7 Crimes Per 1,000 People
-
Shoplifting: 15.2 Crimes Per 1,000 People
-
Other theft: 13.5 Crimes Per 1,000 People
-
Vehicle crime: 11.3 Crimes Per 1,000 People
-
Burglary: 5.86 Crimes Per 1,000 People
-
Robbery: 2.66 Crimes Per 1,000 People
-
Bicycle theft: 1.95 Crimes Per 1,000 People
-
Possession of weapons: 1.75 Crimes Per 1,000 People
-
Theft from the person: 1.69 Crimes Per 1,000 People
7- Waterfront North
Overall Crime Rate: 123 Crimes Per 1,000 People
Waterfront North is famously associated with The Royal Liver Building, The Cunard Building, The Port of Liverpool Building, UNESCO World Heritage Site. Mersey Ferries, Museum of Liverpool, and Cruise Terminal. The overall crime rate in Waterfront North is 234 crimes per 1,000 people.
What are the most common crimes in Waterfront North?
Here is the list of the most common and prominent crimes that happened in Waterfront North (Mar 2024 – Feb 2025):
-
Violence and sexual offences: 72.8 Crimes Per 1,000 People
-
Drugs: 30.6 Crimes Per 1,000 People
-
Criminal damage and arson: 25.9 Crimes Per 1,000 People
-
Anti-social behaviour: 24.2 Crimes Per 1,000 People
-
Public order: 22.8 Crimes Per 1,000 People
-
Vehicle crime: 18.8 Crimes Per 1,000 People
-
Other theft: 13.5 Crimes Per 1,000 People
-
Burglary: 7.28 Crimes Per 1,000 People
-
Other crime: 5.15 Crimes Per 1,000 People
-
Shoplifting: 4.27 Crimes Per 1,000 People
-
Bicycle theft: 2.67 Crimes Per 1,000 People
-
Possession of weapons: 2.37 Crimes Per 1,000 People
-
Theft from the person: 2.28 Crimes Per 1,000 People
-
Robbery: 1.94 Crimes Per 1,000 People
8- Kirkdale East
Overall Crime Rate: 221 Crimes Per 1,000 People
Kirkdale East has its own local significance and is widely known for its Historical Significance, Working-Class Heritage, Kirkdale Gaol (Former), Kirkdale Industrial Schools, the Leeds and Liverpool Canal, Railway Connections, Kirkdale Cemetery, and many more. The overall crime rate in Kirkdale East is 221 crimes per 1,000 people, making it one of the most dangerous areas in Liverpool.
What are the most common crimes in Kirkdale East?
Here is the list of the most common and prominent crimes that happened in Kirkdale East (Mar 2024 – Feb 2025):
-
Violence and sexual offences: 91.9 Crimes Per 1,000 People
-
Public order: 21.4 Crimes Per 1,000 People
-
Anti-social behaviour: 20.8 Crimes Per 1,000 People
-
Drugs: 19.9 Crimes Per 1,000 People
-
Criminal damage and arson: 18.6 Crimes Per 1,000 People
-
Shoplifting: 13 Crimes Per 1,000 People
-
Vehicle crime: 11.6 Crimes Per 1,000 People
-
Other theft: 10 Crimes Per 1,000 People
-
Burglary: 5.91 Crimes Per 1,000 People
-
Other crime: 3.34 Crimes Per 1,000 People
-
Possession of weapons: 2.15 Crimes Per 1,000 People
-
Robbery: 1.42 Crimes Per 1,000 People
-
Bicycle theft: 0.703 Crimes Per 1,000 People
-
Theft from the person: 0.493 Crimes Per 1,000 People
9- Old Swan West
Overall Crime Rate: 199 Crimes Per 1,000 People
Old Swan West is one of the most popular residential areas and is known for its Shopping and Local Businesses, Community Atmosphere, Residential Character, Proximity to Other Areas, and Local Schools and Parks. The overall crime rate here is 199 crimes per 1,000 people, which is considered average.
What are the most common crimes in Old Swan West?
Here is the list of the most common and prominent crimes that happened in Old Swan West (Mar 2024 – Feb 2025):
-
Violence and sexual offences: 60.7 Crimes Per 1,000 People
-
Shoplifting: 34.5 Crimes Per 1,000 People
-
Public order: 23.6 Crimes Per 1,000 People
-
Anti-social behaviour: 16.2 Crimes Per 1,000 People
-
Criminal damage and arson: 15.4 Crimes Per 1,000 People
-
Drugs: 14.3 Crimes Per 1,000 People
-
Other theft: 13.4 Crimes Per 1,000 People
-
Vehicle crime: 7.4 Crimes Per 1,000 People
-
Burglary: 5.02 Crimes Per 1,000 People
-
Other crime: 3.97 Crimes Per 1,000 People
-
Bicycle theft: 1.71 Crimes Per 1,000 People
-
Robbery: 0.972 Crimes Per 1,000 People
-
Theft from the person: 0.951 Crimes Per 1,000 People
-
Possession of weapons: 0.89 Crimes Per 1,000 People
10- County
Overall Crime Rate: 188 Crimes Per 1,000 People
County is one of the famous and well-known wards in Liverpool, renowned for being an electoral ward of Liverpool City Council, County Road, residential communities, historical significance, and many more. When discussing the overall crime rates in the County, they are 188 crimes per 1,000 people, making it one of the top 10 most dangerous areas in Liverpool.
What are the most common crimes in County?
Here is the list of the most common and prominent crimes that happened in the County (Mar 2024 – Feb 2025):
-
Violence and sexual offences: 78 Crimes Per 1,000 People
-
Drugs: 22.9 Crimes Per 1,000 People
-
Public order: 21 Crimes Per 1,000 People
-
Criminal damage and arson: 16.4 Crimes Per 1,000 People
-
Anti-social behaviour: 12.3 Crimes Per 1,000 People
-
Other theft: 8.27 Crimes Per 1,000 People
-
Vehicle crime: 6.95 Crimes Per 1,000 People
-
Burglary: 6.67 Crimes Per 1,000 People
-
Shoplifting: 5.77 Crimes Per 1,000 People
-
Other crime: 4.69 Crimes Per 1,000 People
-
Possession of weapons: 1.92 Crimes Per 1,000 People
-
Robbery: 1.55 Crimes Per 1,000 People
-
Theft from the person: 0.957 Crimes Per 1,000 People
-
Bicycle theft: 0.903 Crimes Per 1,000 People
What Are the Safest Areas in Liverpool?
If you are looking to move to Liverpool, UK, but don’t know the area will be the best for you in terms of safety and security, here are the top 5 safest areas in Liverpool where you can live or do business without any issue:
-
Calderstones: 25.1 crimes per 1,000 people
-
Mossley Hill: 28.9 crimes per 1,000 people
-
Aigburth: 42.4 crimes per 1,000 people
-
Grassendale & Cressington: 44.1 crimes per 1,000 people
-
Childwall: 45.1 crimes per 1,000 people
Here is a list of some more famous areas in Liverpool where you can live or do business safely:
-
Croxteth Country Park: 45.3 Crimes Per 1,000 People – Low
-
Allerton: 45.5 Crimes Per 1,000 People – Low
-
Gateacre: 48.3 Crimes Per 1,000 People – Low
-
Church: 49.8 Crimes Per 1,000 People – Low
-
St. Michael’s: 55.7 Crimes Per 1,000 People – Low
How Does Liverpool Compare to Other UK Cities?
| City Name | Crime Rate | Rate Difference |
|---|---|---|
| City of London | 28.93 | 77% safer |
| Tower Hamlets | 98.60 | 21% safer |
| Sheffield | 102.94 | 17% safer |
| Camden | 108.07 | 13% safer |
| Nottingham | 110.86 | 11% safer |
| Liverpool | 124.42 | – |
| Birmingham | 128.63 | 3.4% more dangerous |
| Bristol | 130.84 | 5% more dangerous |
| Westminster | 132.94 | 7% more dangerous |
| Leeds | 139.98 | 13% more dangerous |
Summary of Crimes in Liverpool
Here is the summary of the crime rates in Liverpool and unfortunately, the statistics are becoming worse with every passing day. If you are living in Liverpool, always be aware of your surroundings and let law authorities and police know if something unusual passes by your eyes.
| Type of Crime | Count in Liverpool | Count in Merseyside | Rate Difference |
|---|---|---|---|
| Anti-Social Behaviour | 6,414 | 15,461 | 17% more dangerous |
| Bicycle Theft | 523 | 1,308 | 12% more dangerous |
| Burglary | 2,183 | 5,576 | 10% more dangerous |
| Criminal Damage and Arson | 5,458 | 14,061 | 9% more dangerous |
| Drugs | 6,382 | 11,255 | 60% more dangerous |
| Other Crime | 1,560 | 3,120 | 41% more dangerous |
| Other Theft | 4,396 | 9,874 | 25% more dangerous |
| Possession of Weapons | 554 | 1,290 | 21% more dangerous |
| Public Order | 7,223 | 20,893 | 2.7% safer |
| Robbery | 564 | 1,250 | 27% more dangerous |
| Shoplifting | 4,891 | 8,281 | 66% more dangerous |
| Theft From the Person | 998 | 1,907 | 47% more dangerous |
| Vehicle Crime | 2,979 | 6,993 | 20% more dangerous |
| Violence and Sexual Offences | 25,201 | 66,534 | 7% more dangerous |
How to Stay Safe in Liverpool?
Here are some tips and recommendations to improve your security and enhance your living standards in Liverpool:
For Residents:
1- Safety Gear
Carrying safety gear like pepper spray, steel folding sticks, and personal alarms can help a lot in enhancing your security and safety while living in Liverpool.
2- Property Safety
You can improve the security of your premises with the help of some essential tools like CCTV cameras, alarm security services, door alarms, motion detectors, etc.
3- Secured Routes
Make sure to take the well-lit and busy routes especially while travelling at nighttime. Avoid shortcuts because these kinds of routes usually are dark and the favourite places for robbers.
For Business:
Running a business in a higher-risk area? Professional security services can make a big difference in keeping your workplace safe and stress-free. Here’s how we can help:
-
Alarm Response & Keyholding: If your alarm goes off after hours, we’ll be there fast to check things out and make sure everything’s okay.
-
Mobile Patrols: Our patrols keep an eye on your property, scaring off troublemakers and giving your team and customers peace of mind.
-
On-Site Security: Having a security guard on-site means your staff, customers, and property are protected 24/7.
How Has Guard Mark Security Sourced This Data?
At Guard Mark Security, we do our best to provide accurate and reliable information to our readers. To ensure legitimacy, we only collect data from authentic and trusted sources.
For this blog, all the statistics and figures have been sourced from the Crime Rate website and the UK’s official police website. You can visit their website and recheck all the crime statistics we have mentioned in our blog for your satisfaction.
Frequently Asked Questions (FAQs)
1- What is the overall crime rate in Liverpool?
The overall crime rate in Liverpool in 2024 is 124.42 crimes per 1,000 people.
2-Is Liverpool Safe?
With a crime rate of 124.42 crimes per 1,000 people, Liverpool is described as one of the most dangerous areas in the UK, according to the statistics provided.
3- Which areas in Liverpool have the highest crime rates?
The top 3 most dangerous areas in Liverpool are:
- City Centre North (742 crimes per 1,000 people)
- Brownlow Hill (461 crimes per 1,000 people)
- Waterfront South (444 crimes per 1,000 people)
4- What are the most common types of crimes in the areas with the highest crime rates in Liverpool?
Violence and sexual offences are the most common crimes in City Centre North, Brownlow Hill, and Waterfront South. Other prevalent crimes vary by area but include shoplifting, drug offences, and public order offences.
5- Which areas are considered the safest in Liverpool based on crime rates?
The top 5 safest areas in Liverpool, according to the data, are:
- Childwall (45.1 crimes per 1,000 people)
- Calderstones (25.1 crimes per 1,000 people)
- Mossley Hill (28.9 crimes per 1,000 people)
- Aigburth (42.4 crimes per 1,000 people)
- Grassendale & Cressington (44.1 crimes per 1,000 people)
6- What types of crimes are most common in the safest areas of Liverpool?
In the safest areas like Calderstones, Mossley Hill, and Aigburth, violence and sexual offences are still the most common category, but the rates are significantly lower compared to the more dangerous areas. Anti-social behaviour and criminal damage, and arson also appear frequently, though at low rates.
7- If I am considering moving to Liverpool, which areas should I consider for safety and security?
Based on the available crime rates, the safest areas to consider living or doing business in Liverpool are Calderstones, Mossley Hill, Aigburth, Grassendale & Cressington, and Childwall. If you want further explanation about the safest areas in Liverpool, check out our latest blog: Top 20 safest areas in Liverpool.
8- Does a high crime rate in an area like City Centre North mean it’s unsafe to visit for tourists?
While City Centre North has the highest reported crime rate in Liverpool (742 crimes per 1,000 people), a significant portion of this may be attributed to crimes like shoplifting and public order offences common in busy commercial and entertainment districts.
Tourists should remain vigilant and aware of their surroundings, especially during peak times, but it doesn’t necessarily mean the area is entirely unsafe for daytime visits to attractions like Liverpool ONE and the Cavern Quarter.
9- Are there any specific times of day or days of the week when crime is more likely in the high-crime areas?
Answer: The provided data gives an overall picture of crime rates per 1,000 people and the types of crimes. For more specific information regarding crime patterns by time of day or day of the week in particular areas, you would need to consult more detailed crime statistics available on the official police website or through local police reports.
Best Security Guarding Services in Liverpool
If you are a business owner and are concerned about the security of your premises in Liverpool, Guard Mark Security is your one-stop shop to fulfil all your security needs. We have professional security guards and can help you monitor the CCTV cameras of your business. Moreover, all of our security guards have specialised training and know the security protocols.
Worried about safety in Liverpool?
Contact us now and let us know your security concerns so we can help you create a customised plan that suits perfectly according to your property’s layout. Our expert and knowledgeable customer support team is here 24/7 to answer all your queries in the best manner.