
Vehicle crime is one of the major crime issues in the United Kingdom and almost everyone has to face it at least once in a lifetime. This crime is not as common as theft or burglary but due to the costly vehicles, it’s one of the crucial issues for the residents. In some areas, the vehicle crime rate is so high that criminals don’t even hesitate to steal the vehicles and ride them in the centre of the city. In many areas, breaking the windows of vehicles and destroying the paintwork are common offences.
It is important to take care of your vehicles because many times, thieves don’t just take your car for the sake of selling but they use it in criminal activities. In many cases, the local residents have filed complaints about missing cars and police have found that their vehicles were being involved in robberies and gang fights. This is the reason, you have to take preventive measures. To prevent vehicle theft, you can rent a garage or install CCTV cameras right in front of your house recording the parking space. By taking these preventive measures, you can mitigate the risk before it escalates.
As you know, at Guard Mark Security, we provide you with detailed reports and articles regarding the crime rates in different items and how you can protect yourself and your assets in difficult times when the crime rate is increasing by a huge margin. In today’s article, we are going to share the worst areas when it comes to vehicle crimes. Once we discuss the crime rates and the issues, further we will look at the areas which areas are safe and best to avoid such crimes and illegal activities.
Table of Contents
An Overview of Vehicle Crime All Over England & Wales
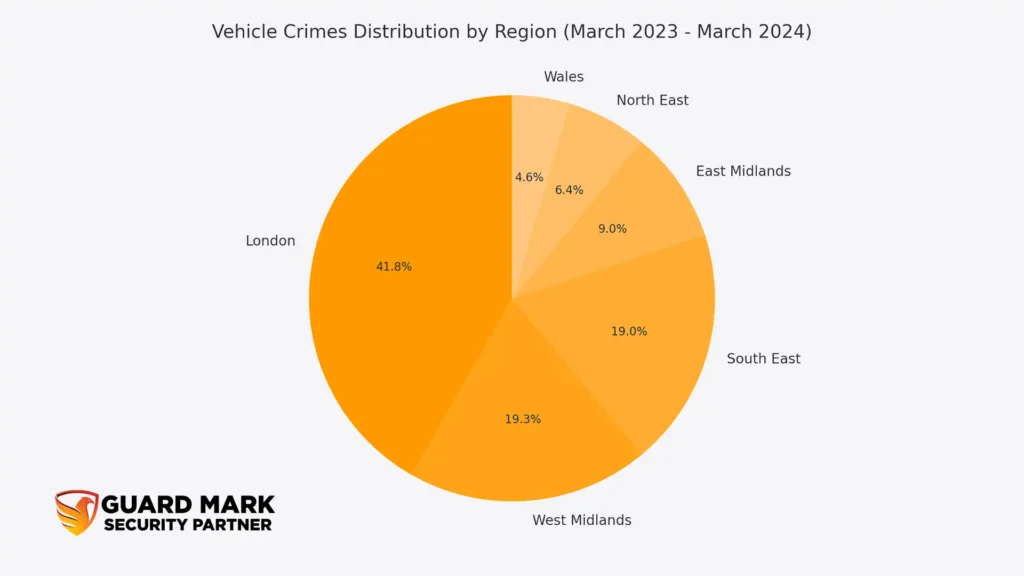
From the start of March 2023 to end of the March 2024, the total number of reported vehicle crimes is 380,209 cases and offences. When we calculate these metrics we found out the average of the vehicle crimes is 6.2 vehicle crimes per 1,000 population. Moreover, as per the metrics provided by the police, vehicle crimes are more frequent than burglary crimes in both residential and commercial places.
When looking at the crime rate, the area most affected is England’s capital – London. Out of the total of vehicle crimes in England and Wales, almost 27.5% happened in London. After London, West Midlands is the area which suffered the most with 12.7% vehicle crimes. The vehicle crime rates in the West Midlands and South East are almost similar (12.5%). Once these high-share crime areas are done, the lower vehicle crime share areas are East Midlands (5.9%), North East (4.2%), and Wales (3%).
It is easy for thieves to steal cars in large major cities like London, Birmingham, Bradford, Manchester, etc. Due to the heavy traffic and population, thieves steal the car and lose in the ocean of the vehicles. Moreover, due to having advanced equipment and tools, they first deactivate or remove the trackers and then take the car to the black markets where markers buy the stolen vehicles and split all the parts of the car to sell separately.
Moreover, black markets don’t always split the vehicles but also change the colour and number plates of the car to sell it in a complete unit. Additionally, the stealers sometimes use those cars for personal use while doing bank robberies or drug business. So, if your car has been stolen or taken away, it is wise to report the local police as soon as possible. This will ensure the law authorities and police are aware that your car has been stolen and you are not involved in any criminal activity.
The Worst Areas for Vehicle Crime in England & Wales
As we have discussed the general overview of vehicle crimes in England and Wales, let’s dive into the crime rates deeper and analyse different cities and areas separately.
England’s Capital – London Vehicle-Related Crimes
London has the highest vehicle crime rate as compared to all the other cities and regions of England. The overall vehicle crime rate in London is 11.8 Offences Per 1,000 Population. Here are some areas and towns in London facing the highest vehicle crime offences:
Our comprehensive report on the most dangerous areas in London provides valuable insights for anyone considering a move to the city.
1- Kensington & Chelsea
Kensington & Chelsea is mostly known for the royalty and elite of the city but when talking about vehicle crimes, the overall vehicle crime rate is 19.4 Offences Per 1,000 Population. When compared with the previous year, the vehicle crime rate here has increased by 10%.
2- City Of Westminster
The City Of Westminster is in the second spot when it comes to the worst vehicle crimes in London with an overall crime rate of 17.1 vehicle Offences Per 1000 Population. In the last year, the total number of reported vehicle crimes is 4,336 in the City of Westminster but also there is a decline of 1% in vehicle crime offences which gives some hope to the residents.
3- Hammersmith & Fulham
Hammersmith & Fulham is famous and well-known for its rich culture and sporting history (football). The overall vehicle crime rate in Hammersmith & Fulham is 15.9 Offences Per 1,000 Population making it in 3rd spot. The total of vehicle crimes in the area last year was 2,945 incidents. But, there is also a decrease of 9% when compared with the previous year’s vehicle crimes and offences.
West Midlands Vehicle-Related Crimes
West Midlands is in the 2nd spot when talking about vehicle crime rates and offences. The overall crime rate in the West Midlands is 8 Vehicle Offences Per 1000 Population. Here are the top 3 areas of the West Midlands that are worst concerning vehicle crimes and offences:
1- Solihull
The overall vehicle crime rate of the Solihull is 13 Offences Per 1000 Population. Solihull is the largest city in the West Midlands and is sandwiched between the Green Belt and the City of Birmingham. The city is facing a high number of vehicle crimes every year. However, the reports witnessed a 1% decrease in the crime rates last year when compared with the previous years.
2- Coventry
The vehicle crime rates of Solihull and Coventry are almost similar. The overall crime rate of Coventry is 13 Vehicle Offences Per 1,000 Population. The city has faced almost 4,755 vehicle offences in the last year. However, the residents have witnessed almost a 10% decrease in vehicle crimes compared to previous years.
3- Birmingham
We often see Birmingham in the newspaper highlights and mostly, it is related to crimes and illegal activities. The overall vehicle crime rate in Birmingham is 12.1 Offences Per 1,000 Population. The city of Birmingham faces on average 13,714 vehicle offences every year. However, as per the Police data, there is a decrease of around 13% in vehicle crimes and offences.
To learn more about the safety of this region, recent crime statistics, and security tips, read our in-depth blog post: Top 10 Most Dangerous Areas in Birmingham
Yorkshire and the Humber Vehicle-Related Crimes
Yorkshire and the Humber are the largest counties in England and Wales. The overall vehicle crime rate in the area is 6.3 Offences Per 1000 Population. Here are the top 3 places that face the highest number of vehicle offences and crimes:
1- Bradford
Bradford is among the top 25 most dangerous areas in England and Wales. The overall vehicle crime rate in Bradford is 11.2 Offences Per 1000 Population. Not just the vehicle offences, but Bradford is facing many other critical issues including theft, drugs, violent crimes, and more. Last year, the residents of Bradford faced around 3,900 vehicle offences and incidents.
2- Doncaster
The overall vehicle crime rate of Doncaster is 9.8 Offences Per 1000 Population. Doncaster is one of the largest cities in Yorkshire and is known for its manufacturing and industrial areas. Last year, Doncaster witnessed almost 3,029 vehicle crimes and offences. After such a huge number of vehicle offences, there is still a decline of 11% in vehicle crimes in the city when compared with the previous years.
3- Leeds
Leeds is known for its rich cultural history, industrial areas, and commercial markets. The overall vehicle crime rate of Leeds is 9.1 Offences Per 1000 Population. In the last year, the area has faced almost 7,211 vehicle offences and crimes. But when compared with the previous years, the crime rate regarding vehicles has dropped by nearly 1%.
Our comprehensive report on the most dangerous areas in Leeds provides valuable insights for anyone considering a move to the city.
North East Vehicle-Related Crimes
When looking at the data provided by the UK’s Police and Office of National Statistics, the vehicle crime rate in the North East is 6 Offences Per 1000 Population. Here are the top 3 places in the North East that have the worst track record regarding vehicle crimes:
1- Middlesbrough
Middlesbrough is always in the highlights when talking about vehicle crimes. But when talking about the good side, Middlesbrough is known for its industrial areas, coal, and ironworks. The overall vehicle crime rate of the area is 11.1 Offences Per 1000 Population. The area has suffered with 1,561 vehicle crimes and offences in the last year.
2- Gateshead
The overall vehicle crime rate of the Gateshead is 10 Offences Per 1000 Population. Last year, the residents of the area witnessed almost 1,195 vehicle crimes and offences. Despite having such a huge number of crimes in a single year, the vehicle crime rate in Gateshead has declined by a significant 22%. Moreover, the local police and law authorities are trying hard to control the situation as soon as possible.
3- Darlington
The overall vehicle crime rate of Darlington is 9.5 Offences Per 1000 Population. The area has suffered from around 884 vehicle crimes and offences. But what’s shocking is the vehicle crime rate in the area has increased by a significant 82% which is eye-opening and a question to the preparation of the police and law authorities.
East England Vehicle-Related Crimes
The overall crime rate regarding vehicles in East England is 5.4 Offences Per 1000 Population. Here are the top 3 areas that have the highest vehicle crime rates in East England:
1- Brentwood
The overall crime rate regarding vehicles in Brentwood is 13.8 Offences Per 1000 Population. In the last single year, the area has suffered from 1,054 vehicle crimes, offences, and incidents. Moreover, the residents witnessed an increase of 15% in vehicle crime rates in the last year as compared to the previous years.
2- Harlow
Harlow is known and famous for its lush green beauty and number of incident statues. The overall vehicle crime rate of the area is 13 Offences Per 1000 Population. But the crime rate here is increasing by a huge margin and in the last year, the number has increased by 36%. The total count of reported vehicle crimes in the last year was 1,219 offences and incidents.
3- Thurrock
The overall crime rate related to cars and vehicles in Thurrock is 12.5 Offences Per 1000 Population. In the last year, the area has witnessed almost 2,217 vehicle offences and incidents. But the good news is the vehicle crime rate has decreased by 11% when compared with the previous years.
Northwest Vehicle-Related Crimes
The overall vehicle crime rate of the North West is 5.1 Offences Per 1000 Population. Here are the top 3 worst places in the North West regarding vehicle crimes and offences:
1- Manchester
We often see Manchester in the news highlighting created to crimes and illegal activities. The overall vehicle crime rate in the area is 11.9 Offences Per 1000 Population. Despite having the highest number of active police officers, the city witnessed almost 6,500 vehicle crimes and incidents last year. Moreover, when compared with the previous years, there is a fall of 14% in the vehicle crime rates in Manchester.
Our full report on the most dangerous areas in Manchester breaks it all down if you’re looking to move to the city.
2- Blackpool
The overall vehicle crime rate in Blackpool is 8.9 Offences Per 1000 Population. The total number of reported vehicle crimes in the area last year was 1,249 incidents. Moreover, the crime rate related to vehicles has dropped by almost 8% as compared to the previous years.
3- Oldham
The overall vehicle crime rate in Oldham is 7.2 Offences Per 1000 Population. The total number of reported vehicle crimes in the area last year was 1,760 incidents. Moreover, the crime rate related to vehicles has dropped by almost 21% as compared to the previous years.
Wales Vehicle-Related Crimes
The overall vehicle crime rate in Wales is 3.7 Offences Per 1000 Population. Here are the top 3 worst places in Wales regarding vehicle crimes and offences:
1- Cardiff
Cardiff is known for its super culture rich history, art, and sports. The overall vehicle crime rate in Cardiff is 9.4 Offences Per 1000 Population. The residents of the area have witnessed almost 3,384 vehicle crimes and incidents in the last year. However, the crime rates regarding cars and other vehicles have dropped by 5% as compared to the previous years.
2- Newport
The overall vehicle crime rate in Newport is 7.4 Offences Per 1000 Population. The total number of reported crimes, offences, and incidents related to cars and other vehicles was 1,179 cases. But the shocking figure is that the vehicle crime rate has increased by a staggering 48% in Newport when compared with the previous years.
3- Blaenau Gwent
Now lastly, the overall vehicle crime rate in the Blaenau Gwent is 5.6 Offences Per 1000 Population. The area has suffered from 388 vehicle-related crimes, offences, and incidents last year. Moreover, the crime rate has increased by 3% in the area when compared with the previous years.
From where does Guard Mark Security Source the Data?
When it comes to research-based articles, we ensure that they are fully transparent so our readers and viewers trust our presented metrics. All the data and metrics we are going to share in this article are taken from the Open Source Police Record and Office Of National Statistics (ONS).
You can visit these websites and double-check all the data if you have any doubts or concerns. Moreover, all the data we are going to analyse is from March 2023 to March 2024 (complete year). Additionally, we will examine all the areas of England and Wales in this article except Scotland and Northern Ireland.